Introducing the SKE GUI: Complete Visibility for Your Platform Builders
- Cat Morris
- Sep 9, 2025
- 3 min read

Updated: Sep 10, 2025
One of the biggest challenges we hear from platform engineers is simple to describe but hard to solve: “I don’t have a clear view of what’s happening across all my platform resources.”
With today’s release of the SKE GUI, we’re changing that.
Available now for Syntasso Kratix Enterprise (SKE) users, the new GUI brings unprecedented visibility into your platform. From a single interface, you can:
See all your Promises and resources in one place
Track their current and historical states
Debug issues in real-time with detailed statuses
Explore a map of how everything fits together
Even OS Kratix users will benefit from the new enhanced statuses.
Why we created the SKE GUI
Building and operating internal platforms can often feel like navigating a maze blindfolded. Cloud providers, observability tools, and even infrastructure-as-code tools claim to provide a single pane of glass view into all their resources and services.
This is fine, but what if you have multiple clouds, all using different IaC tools, and you don’t own the observability stack? Knowing which tool to use when something goes wrong, finding the problem, and, most importantly, figuring out how to fix it is often a case of trial and error.
Enter the SKE GUI.
Anyone using SKE as their platform orchestrator will now be able to see all of their platform resources, their current status and how they fit together in our intuitive map view.
This takes all the insight that an Application Developer gets from our Backstage integration and levels it up for the Platform Engineer, so you have enough information to take meaningful action based on the state of your platform.
Key features of the SKE GUI
🔎 Detailed statuses: Understand the precise status of EVERYTHING in your platform.
Both OS Kratix and SKE users now benefit from an enhanced status list and events that comply with the well-documented Kubernetes conventions. Promises, resources and even the lower-level Kratix objects publish context-relevant information for Platform Engineers to debug quickly.
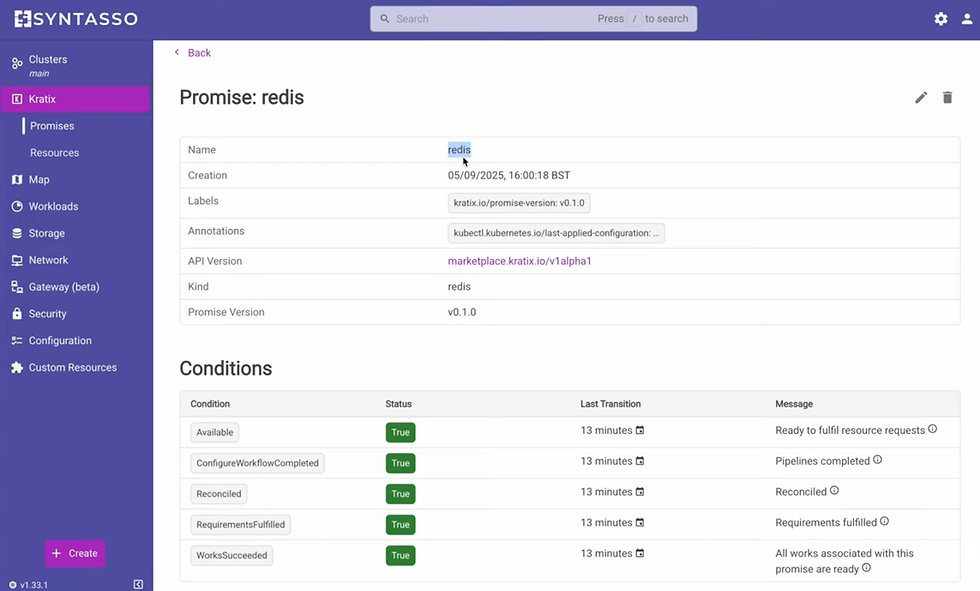
📋 Promise and Resource views: Get the state of your Promises and Resources at a glance. This dedicated view gives you a lightning-fast overview of all your Kratix Promises and Resources.
Ever wanted to know the conditions of a Promise, or when its pipeline last ran? You can jump straight into the pipeline run, see the executed pods, and even grab logs for detailed troubleshooting.
🗺️ Map view: See a complete graph of your Platform. Visually explore your deployed Promises and their relationships, including the resources they created and the pipeline stages that ran.
See the health status of any of these Promises at a glance on this summary view. If you see something you don’t expect, dig into the detailed view directly from the map to debug your Promises, Resources and Pipeline stages!

These features enable platform engineers to monitor the state of their Promises and resource requests, pinpointing failures for quicker debugging and improving overall workflow.
One of our top engineers, Derik, gives you a full, guided tour of the whole SKE GUI experience below!
Want to try it out?
If you are an SKE customer, use our ready-to-go helm chart and install using our recommended defaults, or configure it to fit the specifics of your environment. We support even the most complicated setups by giving you the freedom to set up private registries, ingress rules, security, etc, however you want. Get started by following our docs.
If you are a future SKE customer (hello, and welcome to the next generation of platform building!), head over to syntasso.io, request a trial token, and we’ll be in touch to help you get started.
For those of you using open-source Kratix, all events and statuses are part of the API, so they can be backed by your own automations and interfaces! We’d love to hear how you are using Kratix’s new capabilities to improve observability in your teams.


Comments